What moved oil prices in the previous week? Geopolitics? News? OPEC? Reports from major oil companies about earnings? Mideast violence?
To those who find oil to be as complex as measuring all of these inputs and putting them in perspective, I’ve got a different experience:
Yes, of course large global trends of production, OPEC plans, rumors of war and actual hostilities matter.
But in the aggregate, all those can be measured and are measured through the movements of money in and out of oil futures. It is the most clear representation of how all of the other factors are being weighed – by those actually betting on the future price of oil.
Here’s another piece of news: Those bets are not just an indication of how financial players are thinking, they can be a primary indicator of what the next intermediate (and even long-term) move on oil prices will be.
This was one of the main theses of my first book – Oil’s Endless Bid. At the time of it’s publication, this idea was scoffed at by virtually every oil analyst out there. Today, measuring the financial motion of speculative money in and out of oil futures is considered a necessary tool for anyone trying to gauge oil’s next move.
When watching this indicator, care must be taken – overwhelming interest in speculative owning of oil (being long) is more likely a sign that oil prices are soon headed DOWN. Similarly, a relative lack of interest in being long can be useful in timing oil’s next move up.
Right now, with all of us waiting for oil to naturally rebalance (a long road) and OPEC to continue or abandon production restrictions (an equally long road) the market’s become almost singularly focused on speculative interest in driving prices.
Today, the person delivering the best info on weekly moves in speculative activity in oil is John Kemp of Reuters. I’d recommend getting on his email list by sending him a note at: john.kemp@thomsonreuters.com (here’s hoping he’ll do the same for my blogletter).
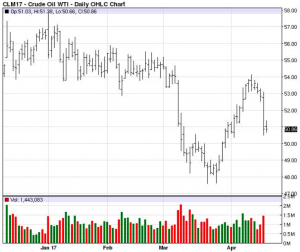
Take a look at this chart, particularly the red line at two recent moments: Early March of this year and the last entry of April 17th. In early March, long positions were reaching historically high levels. Ultimately this resulted in the mini crash of prices from $55 to $48:
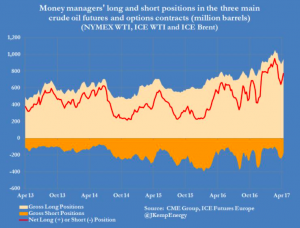
While the creep back up of strong speculative long positions in the last few weeks could have contributed to the mini crash back down towards $51 yesterday.
NOW – Don’t think you’ve found the holy grail of predicting oil prices just because the indicator was so good for these two last examples. All of the other factors that most oil analysts harp upon can be as important or more important in other situations and moments.
At THIS particular moment, tomahawk missiles in Syria and a MOAB deployment in Afghanistan have had minimal impact on oil prices, when at other times in history, they’d have been good for at least a few more dollars in rally.
And that’s my take on recent intermediate oil price movements.
I’d invite you to join me for my next webinar for a much more extensive and interesting discussion of all of these topics and more.